|| Data Analytics Using R Certification Course 

The Data Analytics using R Training course is a specialized program designed to teach students how to leverage the R programming language for comprehensive data analysis and visualization. This course covers essential topics such as data manipulation, statistical modeling, and data visualization, using R's extensive libraries and packages. Students will learn to import, clean, and analyze datasets, perform advanced statistical tests, and create insightful visualizations to interpret data effectively. The curriculum includes practical exercises and real-world projects, ensuring that participants gain hands-on experience in applying R to solve complex analytical problems. Students will explore the fundamentals of R, learning how to import, clean, manipulate, and visualize data effectively. Through a combination of theoretical lessons and practical hands-on exercises, participants will gain proficiency in using R’s extensive libraries and packages for tasks such as statistical modeling, hypothesis testing, and creating compelling data visualizations. By the end of the course, students will be equipped with the knowledge and practical experience needed to tackle real-world data challenges and derive meaningful insights using R.


The benefits of this course are significant. By mastering R, participants will acquire a powerful toolset for data analysis, widely used in academia and industry for its versatility and robust statistical capabilities. This expertise enhances career prospects in fields such as data science, market research, bioinformatics, and financial analysis. Additionally, the course fosters critical thinking and analytical skills, enabling students to extract valuable insights from data and make informed decisions. Overall, the Data Analytics using R course equips individuals with the knowledge and practical skills needed to excel in data-driven roles and contribute effectively to their organizations' analytical capabilities.


R analytics, also known as the R programming language, is an open-source, free program used for various data science, statistics, and visualisation tasks. The R programming language can help you extract the most value from business-critical data since it is strong, flexible, and compatible with BI solutions such as Sisense.After completing this certificate program, students will be prepared to apply for entry-level positions as data analysts. It is not required to have any prior experience. 


Please contact the nearest BIT training institute or send an email to inquiry@bitbaroda.com with any additional questions you may have regarding our Health Care Analytics training course. We offer a free demo by calling us at +91-9328994901. We offer top-notch Health Care Analytics Training in Vadodara-Sayajigunj, Vadodara - Waghodia Road, Vadodara - Manjalpur, Ahmedabad, Anand, and Nadiad.


|| Data Analytics Using R Certification from BIT

BIT Coaching Classes in Vadodara ,Features of BIT Coaching Classes ,1 on 1 training at BIT ,Personalized instruction at BIT,Advantages of taking Admission at Bit

Certificate

|| What will I learn?

  • Learn how to manipulate, clean, and preprocess data using R.
  • Develop practical skills in data analytics through hands-on exercises and projects.
  • Understand best practices and tips for effective data analysis using R.
  • Explore data visualization principles and techniques in R.
  • Participants will gain exposure to advanced topics in R, including machine learning concepts and techniques, working with big data, and optimizing R code and workflows for efficiency.

|| Requirements

  • Basic understanding of statistics and data analysis concepts.
  • No prior experience with R is necessary.

|| Requirements

  • Basic understanding of statistics and data analysis concepts.
  • No prior experience with R is necessary.

|| Significant Scope of Data Analytics

data analytics using R features in india  ,Government and Public Policy ,Education ,Supply Chain and logistics, Retail ,Features of Data Analytics

Certificate

    The "Data Analytics using R" course offers a comprehensive introduction to data analytics with a focus on leveraging the R programming language. Starting with the basics of R and the RStudio environment, participants will learn essential programming skills, including writing scripts and understanding data types. The course then delves into data manipulation using the powerful dplyr package, enabling students to efficiently import, clean, and transform data. Visualization skills are developed using ggplot2, teaching learners to create and customize a variety of plots to effectively communicate data insights. Statistical analysis is a key component, covering both descriptive and inferential statistics, such as hypothesis testing and ANOVA. The course also emphasizes exploratory data analysis (EDA) techniques to uncover patterns and anomalies in data. Predictive modeling is introduced with a focus on regression and classification models, while time series analysis covers forecasting methods. Advanced topics include clustering and dimensionality reduction techniques. Throughout the course, students engage in hands-on projects that simulate real-world data challenges, culminating in the ability to create reproducible reports using RMarkdown and effectively present their findings. By the end of the course, participants will be well-equipped to perform robust data analysis and contribute to data-driven decision-making in various professional contexts.

    • Introduction to R
    • What is R?, 
    • Installing R, 
    • R environment
    • Understanding R data structure 
    • Variables , Scalars
    • Vectors, Matrices, List
    • Data frames, functions, Factors
    • Importing data
    • Reading Tabular Data files
    • Loading and storing data with a clipboard
    • Accessing database, Writing data to file
    • Writing text & output from analyses to file
    • Manipulating Data
    • Selecting rows/observations
    • Rounding Number
    • Merging data
    • Relabeling the column names
    • Data sorting
    • Data aggregation
    • Using functions in R
    • Commonly used Mathematical Functions
    • Commonly used Summary Functions
    • Commonly used String Functions
    • User-defined functions
    • local and global variable
    • Working with dates
    • Looping
    • While loop ,
    • If loop
    • Charts and Plots
    • Box plot, Histogram, 
    • Pie graph ,Line chart
    • Scatterplot, Developing graphs

    • Introduction to R Programming
    • Overview of R and RStudio IDE
    • Basic syntax, data types, and variables in R


    • Data Import and Manipulation
    • Importing data from various sources (e.g., CSV files, Excel spreadsheets, databases)
    • Cleaning and preprocessing data using dplyr and tidyr packages


    • Exploratory Data Analysis (EDA)
    • Summarizing and visualizing data distributions, correlations, and patterns
    • Identifying outliers, missing values, and data inconsistencies


    • Data Visualization with ggplot2
    • Creating static and interactive plots: scatter plots, histograms, bar charts, etc.
    • Customizing plot aesthetics and themes for effective storytelling


    • Statistical Analysis with R
    • Descriptive statistics: mean, median, standard deviation, etc.
    • Inferential statistics: hypothesis testing, confidence intervals, p-values


    • Advanced Data Analytics Techniques
    • Predictive modeling: linear regression, logistic regression, decision trees
    • Cluster analysis: k-means clustering, hierarchical clustering
    • Time series analysis: forecasting, seasonality, trend detection


    • Reporting and Deployment
    • Generating dynamic reports and presentations using RMarkdown
    • Building interactive web applications with Shiny for data visualization and analysis

Get in touch

|| Tools to Master

 data  analytics  using r course tools ,data Analytics using r Learning Tools , PYthon ,Tensorflow , Pytorch ,Google collab , VS Code ,SQL ,Numpy ,Seaborn Excel ,DOCKER

Certificate
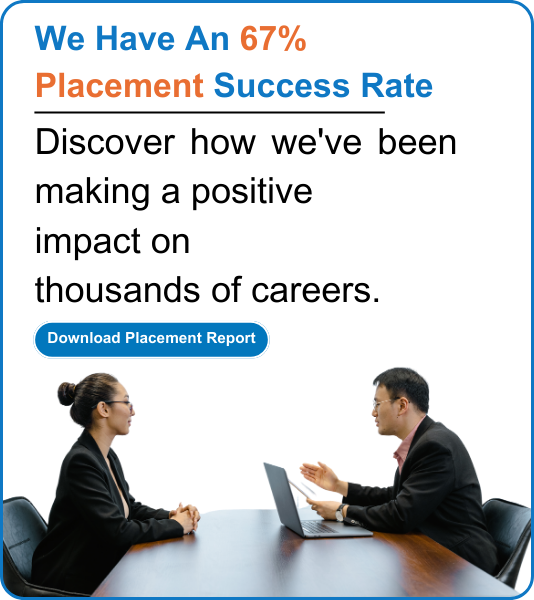
placement report placement report

|| Skills to Master

Data Analytics  using r Skills ,Data Analyst Skills ,Data Collection ,Data Preprocessing, Database Management ,Programming Language ,Data Visualization ,Machine Learning ,Version Control ,Cloud Computing

Certificate

|| Data Analytics Using R offers a variety of Career Options and Job Opportunities 

Here are some potential career paths and roles you can pursue:

  • Data Analyst:
  • Analyse and interpret complex datasets. Generate reports and visualizations to support decision-making. Identify trends and patterns to provide actionable insights.
  • Business Intelligence Analyst:
  • Develop and maintain business intelligence dashboards and reports. Work with stakeholders to understand business requirements. Use R to analyse business performance and market trends.
  • Data Scientist:
  • Design and implement predictive models and machine learning algorithms. Conduct exploratory data analysis (EDA) to uncover insights. Use statistical methods to inform business strategies and decisions.
  • Statistical Analyst:
  • Perform advanced statistical analysis on large datasets. Develop statistical models to solve business problems. Communicate findings to non-technical stakeholders through reports and visualizations.
  • Market Research Analyst:
  • Conduct research to understand market trends and consumer behaviour. Use R to analyse survey data and generate insights. Help businesses develop marketing strategies based on data findings.
  • Healthcare Data Analyst:
  • Analyse healthcare data to improve patient outcomes and operational efficiency. Develop models to predict patient readmissions and treatment effectiveness. Work with healthcare professionals to inform policy and practice changes.
  • Financial Analyst:
  • Use R to analyze financial data and create forecasts. Assess financial risks and opportunities through data-driven analysis. Support investment decisions with quantitative models.
  • Operations Analyst:
  • Optimize business processes and improve operational efficiency through data analysis. Develop models to predict operational outcomes and reduce costs. Collaborate with various departments to implement data-driven improvements.
  • Data Visualization Specialist:
  • Create compelling visualizations to communicate data insights. Develop dashboards and interactive reports using R and visualization tools. Work with teams to present complex data in an accessible format.
  • Research Scientist:
  • Conduct research using statistical and analytical methods. Analyse experimental data and publish findings in scientific journals. Collaborate with academic and industry researchers on data-driven projects.
  • Big Data Analyst:
  • Work with large datasets using big data technologies like Hadoop and Spark. Use R for data preprocessing, analysis, and visualization. Extract meaningful insights from massive amounts of data to inform strategic decisions.
  • Consultant:
  • Provide expert advice on data analytics and statistical methods. Help organizations implement data-driven solutions. Conduct training sessions and workshops on data analytics using R.

|| Job Role & Salary 

DATA ANALYTICS USING R JOB ROLE ,Data Analyst Using R Job Roles in India ,Data Analyst ,Data Scientist ,Business Intelligence  Analyst , Data Engineer ,Data Architecture ,Big Data Specialist ,Healthcare Analyst

Certificate

|| Companies Which use Data Analytics Using R in India

  • Tata Consultancy Services (TCS):
  • Uses R for big data analytics and machine learning projects. Employs R for customer analytics and market research.
  • HDFC Bank:
  • Uses R for credit risk modelling and fraud detection. Employs R for customer segmentation and targeted marketing.
  • Sun Pharmaceutical Industries:
  • Utilizes R for epidemiological studies and health data analysis. Analyses pharmaceutical data to support research and development.
  • Amazon India:
  • Utilizes R for market analysis and demand prediction. Analyses customer data to enhance shopping experiences and optimize logistics.
  • Deloitte India:
  • Uses R for data analytics and visualization in consulting projects. Employs R for risk assessment and financial analysis.
  • Indian Institutes of Technology (IITs):
  • Use R for data science and analytics courses. Employ R for research data analysis in various academic disciplines.
  • Google:
  • Uses R for data analysis and visualization in various projects. Employs R for statistical modelling and data mining.


Many other small, medium and giant companies use Data Analytics using R for their tasks, it is almost used in each and every sector we can possibly think of in today's world. 

|| Top Hiring Companies

Hiring Companies ,Top Companies ,Job Placement ,Patterns,Cognizant,Ananta ,Tech Mahindra ,Rapido ,Accenture ,Top Hiring Companies at BIT , Top Placement Companies at BIT ,Top Placement Opportunities at BIT

Certificate

|| Placement Opportunities after Data Analytics Using R

After completing a course in data analysis using R, graduates have robust placement opportunities across various sectors. Companies in technology, finance, healthcare, e-commerce, and consulting actively seek professionals skilled in R for roles such as Data Analyst, Data Scientist, Business Analyst, and Business Intelligence Analyst. Prestigious organizations like Infosys, TCS, HDFC Bank, ICICI Bank, Amazon, Flipkart, and healthcare giants like Dr.Reddy’s Laboratories and Sun Pharmaceutical Industries often hire data professionals proficient in R. Additionally, startups and government agencies such as the National Informatics Centre (NIC) and the Reserve Bank of India (RBI) offer promising roles. There are many opportunities available in Abroad as well in countries like US, UK, Germany and Australia so on. These opportunities are particularly abundant in major Indian cities like Bangalore, Mumbai, Delhi NCR, and Hyderabad, where the demand for data-driven decision-making continues to grow.

|| Empowering Your Career Transition From Learning To Leading

User Image
Rajvi Suthar

Rajvi Suthar, excelling as a Data Analyst at Tata Consultancy Services (TCS), leverages unique tools such as Python for scripting, R for statistical analysis, and Alteryx for data blending. Her adept use of these cutting-edge tools contributes to efficient and advanced data analysis solutions.

User Image
Sarthak Gupta

Sarthak Gupta, demonstrating mastery as a Business Data Analyst at Accenture, leverages unique tools such as Power BI for visual analytics, Python for data scripting, and Alteryx for data blending. His adept use of these cutting-edge tools contributes to efficient and advanced business data analysis solutions.

User Image
Megha Bhatt

Megha Bhatt, demonstrating prowess as a ML Engineer at Cognizant, leverages unique tools such as Alteryx for advanced data blending, Google BigQuery for large-scale data analytics. Her adept use of these cutting-edge tools contributes to innovative and efficient data analysis.

User Image
Rishabhjit Saini

Rishabhjit Saini, demonstrating mastery as a Senior Data Processing professional at NielsenIQ, leverages unique tools such as Talend for data integration, Apache Spark for big data processing, and Trifacta for advanced data wrangling. His adept use of these cutting-edge tools contributes to efficient and innovative data handling.

User Image
Darshna Dave

Darshna Dave, excelling as a Data Engineer at Deepak Foundation post-IT institute, showcases expertise in unique tools such as KNIME for data analytics workflows, Apache Superset for interactive data visualization, and RapidMiner for advanced predictive analytics.

|| Get Data Analytics using R Certification 

Three easy steps will unlock your Data Analytics Using R Certification:


  • Finish the online / offline course of Data Analytics Using R Course and the Assignment
  • Take on and successfully complete a number of industry-based Projects
  • Pass the Data Analytics Using R Certification exam


The certificate for this Data Analytics Using R Certification will be sent to you through our learning management system, where you can also download it. Add  a link to your certificate to your CV or LinkedIn profile.


Certificate

|| Frequently asked question

R is an advanced language that performs various complex statistical computations and calculations. Therefore, it is widely used by data scientists and business leaders in multiple fields, from academics to business. Moreover

Leading language when it comes to comprehensive statistical analysis packages , Community-developed code enhancements and bug fixes.

Open-Source. ... Strong Ability to Design Graphics. ... Extensive Range of Packages. ... Efficient in Software Development. ... Computing in a Distributed Environment. ... Data Wrangling. ... No Compilation. ... Enables Quick Calculations.

BIT offers a wide range of programs catering to various interests and career paths. These may include academic courses, vocational training, professional development, and more. Please visit our website – www.bitbaroda.com or contact our admissions office at M.9328994901 for a complete list of programs.

For any questions or assistance regarding the enrolment process, admissions requirements, or program details, please don't hesitate to reach out to our friendly admissions team. Please visit our website – www.bitbaroda.com or contact our admissions office at M.9328994901 for a complete list of programs or Visit Our Centers – Sayajigunj, Waghodia Road, Manjalpur in Vadodara, Anand, Nadiad, Ahmedabad

BIT prides itself on providing high-quality education, personalized attention, and hands-on learning experiences. Our dedicated faculty, state-of-the-art facilities, industry partnerships, and commitment to student success make us a preferred choice for students seeking a rewarding educational journey.

BIT committed to supporting students throughout their academic journey. We offer a range of support services, including academic advising, tutoring, career counselling, and wellness resources. Our goal is to ensure that every student has the tools and support they need to succeed.

Yes, many courses provide additional resources, including: Recommended textbooks. Online tutorials and articles. Access to community forums and groups.

Most courses offer a certificate of completion, often subject to passing assessments or completing projects.

R and RStudio installed on your computer. Internet access for downloading packages and accessing course materials.

The course typically includes: Lectures and reading materials. Hands-on coding exercises. Quizzes and assignments. Real-world data analysis projects. Discussion forums for peer interaction and support.

Introduction to R and RStudio. Data manipulation using dplyr. Data visualization with ggplot2. Statistical analysis techniques. Working with different types of data (text, time-series, etc.). Machine learning basics using R.

This course is designed for: Data analysts looking to enhance their skills. Beginners in data analytics. Professionals in related fields (e.g., finance, marketing) seeking to leverage data analysis. Students in data science or related disciplines.
-->
Call Now!